

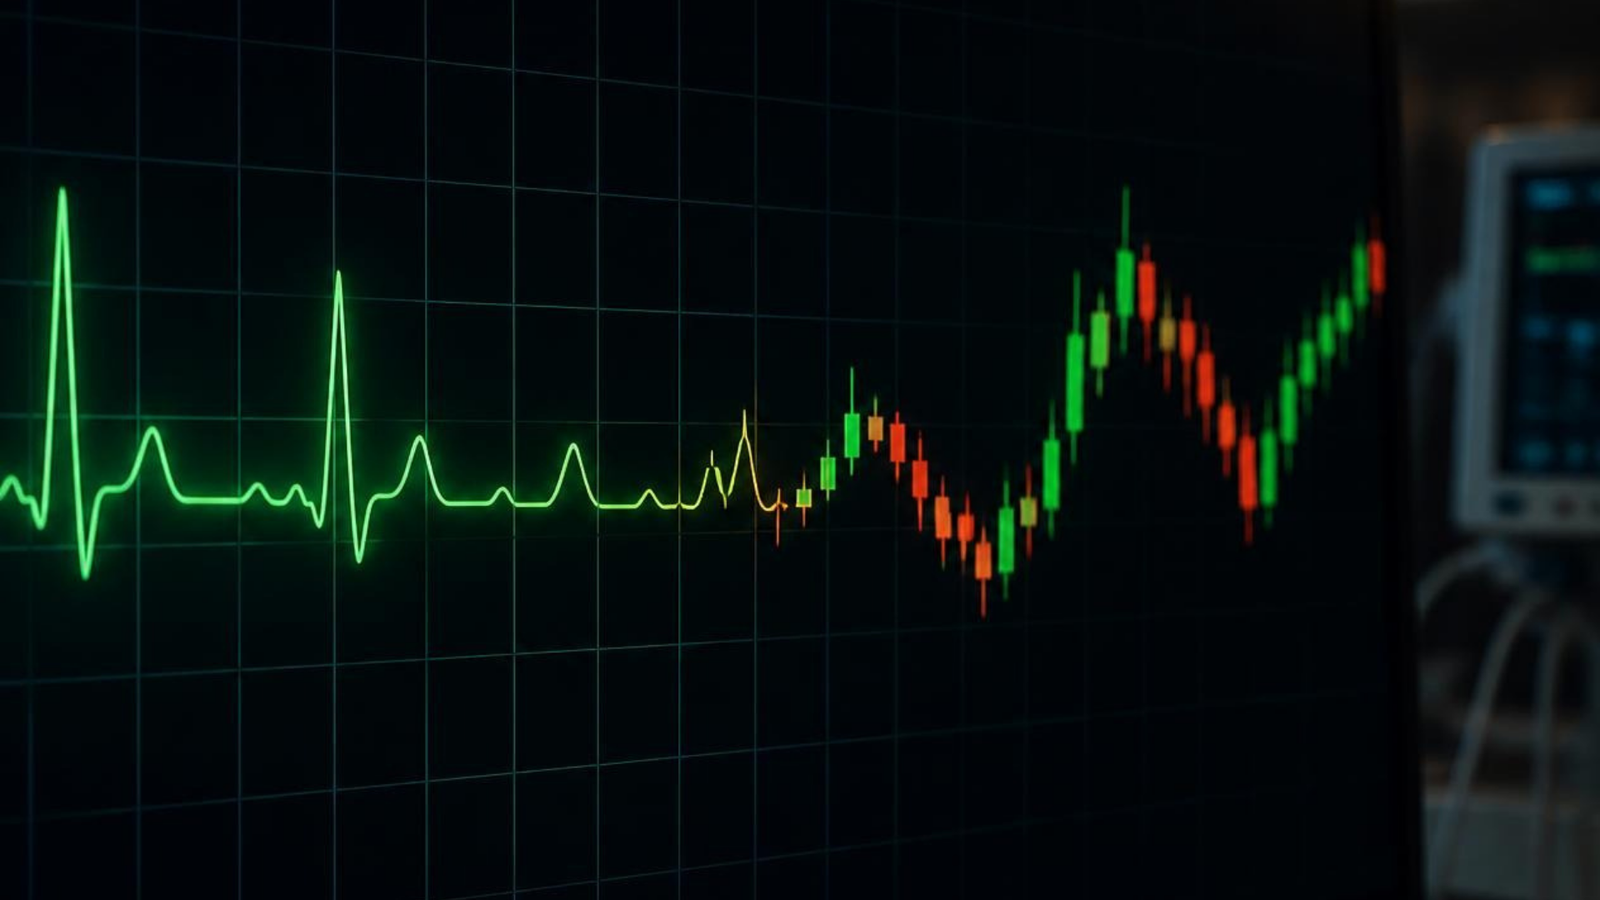
Beyond Price: Learning to Read the Market’s Emotional Language
A reflection on candlestick charts, technical analysis, and market psychology inspired by Steve Nison
“Charts speak the language of emotion.”
— Steve Nison
By Debaditya Chatterjee
Editorial for INVSTORY
Every Chart Records More Than Price. It Records Human Behaviour.
Every trading day leaves behind thousands of candlesticks.
Most people see them as coloured bars moving across a screen.
Experienced market participants see something entirely different.
Every candlestick is a record of conviction.
Every shadow reflects hesitation.
Every closing price represents a temporary agreement between buyers and sellers.
Long before news headlines explain what happened, price action often reveals how market participants are thinking.
That is why Steve Nison’s observation remains one of the most profound ideas in technical analysis:
“Charts speak the language of emotion.”
Candlestick charts do not predict the future.
They reveal the psychology that is shaping the present.
Price Is the Market’s Most Honest Form of Communication.
Opinions differ.
Forecasts change.
Economic narratives evolve.
Price does only one thing.
It reflects every publicly available decision made by buyers and sellers.
A financial statement explains a business.
An economic report explains an economy.
A candlestick chart explains behaviour.
When optimism grows, price often reflects it before confidence becomes obvious.
When fear quietly enters the market, price frequently begins to weaken before the narrative changes.
Charts therefore become far more than analytical tools.
They become evidence.
Every Candlestick Pattern Represents a Human Decision.
A bullish engulfing pattern is not merely a textbook formation.
It reflects a shift in conviction.
A doji is not simply a candle with a small body.
It reflects hesitation and balance.
A hammer is not important because of its shape.
It becomes important because it shows rejection of lower prices.
Understanding candlestick patterns begins with recognising that every pattern represents changing behaviour, not changing geometry.
Price moves because people change their minds.
The chart simply records that transition.
Technical Analysis Is the Study of Behaviour Under Uncertainty.
One of the biggest misconceptions about technical analysis is that it attempts to predict the future with certainty.
That has never been its purpose.
Its purpose is to evaluate probabilities.
It asks questions such as:
- Is buying pressure strengthening?
- Is selling pressure fading?
- Is momentum confirming the trend?
- Is market sentiment beginning to change?
- Is risk improving relative to potential reward?
These are questions of observation.
Not prediction.
The experienced trader does not ask the chart to provide certainty.
They ask it to provide evidence.
Traders and Investors Read the Same Chart Through Different Lenses.
A trader studies price action to identify opportunities over the coming hours, days, or weeks.
An investor studies market behaviour to understand whether price has temporarily diverged from underlying business value.
Neither perspective is superior.
They simply operate on different time horizons.
Both, however, begin by listening to the message the market is already communicating.
That shared foundation is what makes charts valuable across every style of market participation.
The Greatest Edge Is Not Pattern Recognition. It Is Interpretation.
Technology has made identifying chart patterns remarkably easy.
Software can recognise hundreds of formations within seconds.
Yet technology cannot replace judgement.
The true edge comes from understanding context.
A breakout supported by expanding participation carries different meaning than one driven by weak conviction.
A reversal at a major support zone tells a different story than the same candle appearing in the middle of a trading range.
Patterns matter.
Context matters more.
Emotion Moves Markets Before Logic Explains Them.
Every major advance begins with uncertainty.
Every major decline begins while optimism still dominates.
Markets rarely wait for unanimous agreement.
They move as expectations begin to change.
This is why experienced market participants spend less time predicting headlines and more time observing behaviour.
Charts do not reveal tomorrow’s news.
They reveal today’s balance between confidence and caution.
And that balance often changes before public opinion catches up.
A Final Reflection
Steve Nison transformed modern chart analysis by introducing the world to Japanese candlestick techniques.
His greatest contribution, however, extends beyond the charts themselves.
He reminded generations of traders and investors that markets are driven not only by numbers, but by human emotion.
Fear.
Greed.
Hope.
Doubt.
Conviction.
Patience.
These emotions have shaped markets for centuries, and every trading session leaves their imprint on price.
The challenge is not to memorise every candlestick pattern.
The challenge is to understand the human behaviour those patterns represent.
Because successful market participants do not merely read charts.
They learn to read people through charts.
Continue the Conversation
At INVSTORY, we believe that exceptional investing and trading begin with disciplined observation rather than confident prediction. By combining technical analysis, market psychology, behavioural finance, and evidence-based decision-making, we aim to help traders and investors interpret financial markets with greater clarity, stronger discipline, and a long-term perspective.
© 2026 INVSTORY. Editorial written by Debaditya Chatterjee for INVSTORY.