

Chart Patterns: Why Market Behaviour Repeats Through Human Psychology
MARKET MINDSET
Editorial Journal on Capital Markets, Investment Psychology & Professional Decision-Making
An Editorial by Debaditya Chatterjee
Editor, Market Mindset
Capital Markets Educator | Helping Market Participants Think Like Professionals | Trader & Investor | Market Psychology | Trading Discipline | Capital Markets Research
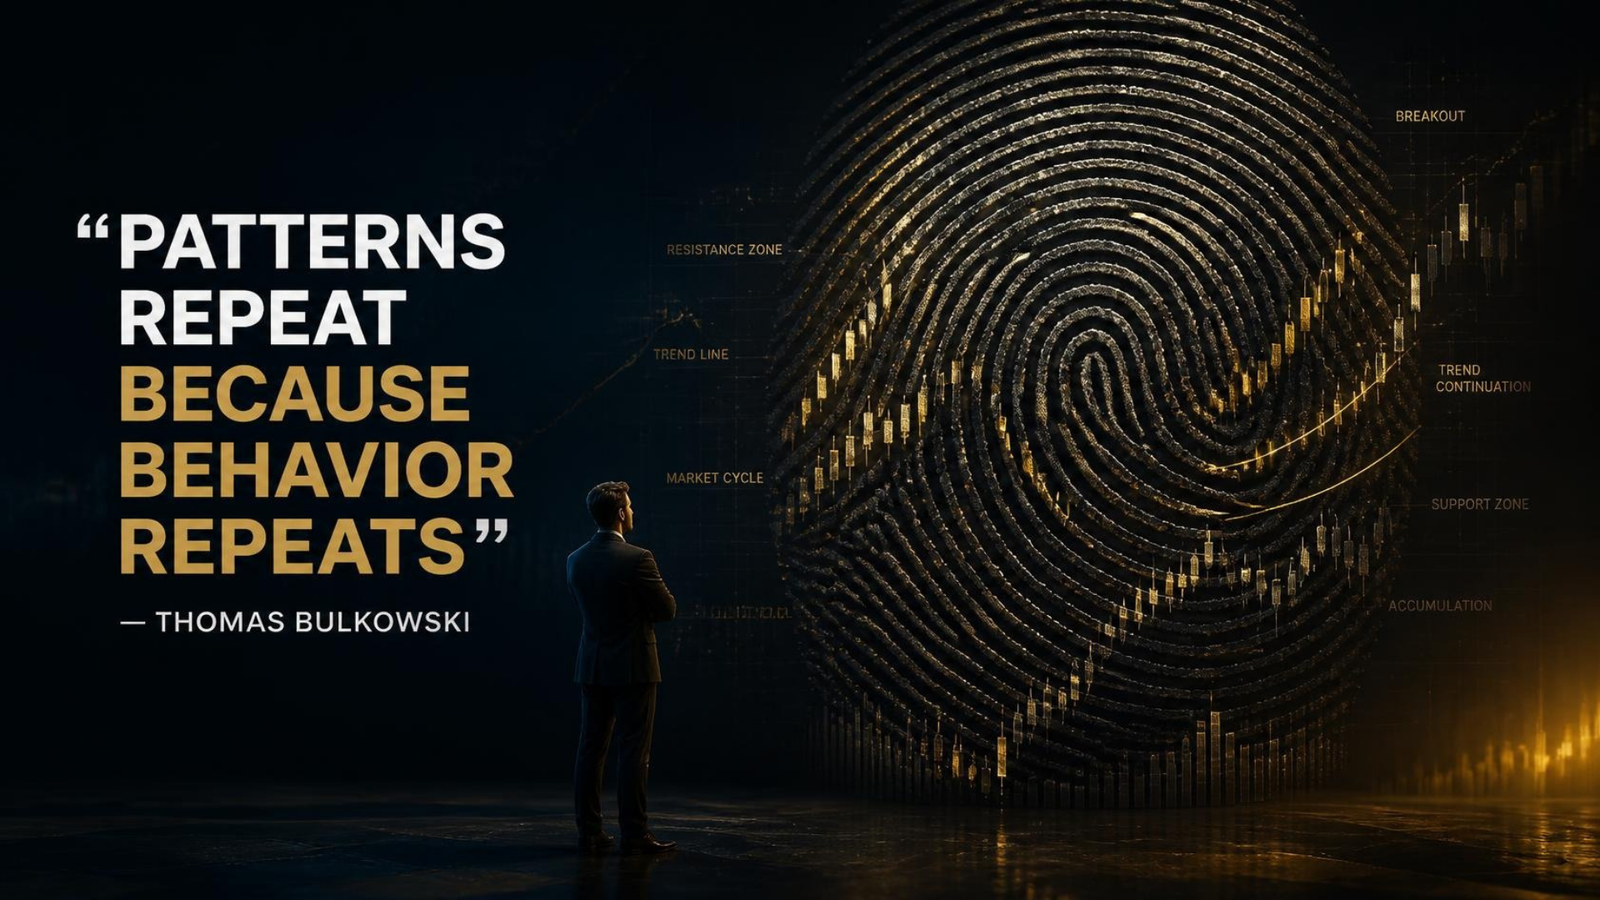
“Patterns repeat because behavior repeats.”
— Thomas Bulkowski
Financial markets appear different every day.
New companies enter the exchange.
New technologies transform industries.
New economic events influence investor sentiment.
Yet beneath this constant change, one element remains remarkably consistent:
Human behaviour.
Markets are ultimately the collective expression of millions of decisions made by individuals, institutions, algorithms, and investors responding to uncertainty.
Fear.
Greed.
Hope.
Panic.
Confidence.
Regret.
These emotions have remained unchanged throughout financial history.
This is the foundation behind one of the most fascinating areas of technical analysis: chart patterns.
Thomas Bulkowski, one of the most respected researchers in the field of chart pattern analysis, dedicated decades to studying historical price formations, measuring their statistical behaviour, and understanding how recurring structures appear across different market environments.
His observation that “patterns repeat because behavior repeats” captures a deeper truth about financial markets.
Chart patterns are not simply shapes appearing on a screen.
They are visual representations of collective human decision-making.
Beyond Lines and Shapes: Understanding the Psychology Behind Chart Patterns
A common misunderstanding among new traders is that chart patterns work because certain formations possess predictive power by themselves.
Professional traders approach them differently.
A chart pattern does not predict the future.
It reflects the ongoing battle between buyers and sellers.
Every candle represents a decision.
Every breakout represents a shift in supply and demand.
Every consolidation represents a period of uncertainty where market participants reassess expectations.
A triangle pattern, for example, is not valuable because of its geometric appearance.
It represents a period where buyers and sellers gradually reach a temporary balance before one side gains control.
A double top is not merely two peaks on a chart.
It reflects repeated rejection of higher prices, showing that sellers are defending a particular area.
A breakout is not simply a movement above resistance.
It represents changing expectations among thousands of participants who collectively decide that previous valuation levels are no longer acceptable.
The pattern is the visible outcome.
The behaviour behind it is the real story.
Markets Change. Human Psychology Does Not.
One of the greatest challenges in financial markets is separating temporary changes from permanent principles.
Technology has transformed how markets operate.
Execution is faster.
Information is instantly available.
Artificial intelligence and quantitative systems analyse enormous amounts of data.
Yet the emotions driving market decisions remain remarkably similar.
The investor who buys after a strong rally because of fear of missing out is responding to the same emotion that influenced participants decades ago.
The trader who refuses to exit a losing position because they hope for recovery is experiencing the same psychological conflict observed throughout market history.
The institutional investor who accumulates shares during periods of pessimism is following principles that have existed for generations.
Human nature creates repetition.
Repetition creates patterns.
Patterns create opportunities for analysis.
This is why technical analysis continues to remain relevant despite dramatic changes in market structure.
The Research Behind Chart Patterns
Thomas Bulkowski’s contribution to technical analysis was significant because he approached chart patterns through research rather than assumption.
Instead of simply identifying formations visually, he studied thousands of historical examples to understand their behaviour, success rates, failure rates, and performance characteristics.
This approach introduced an important principle:
Patterns should be evaluated through evidence, not belief.
A professional trader does not assume that every pattern will work.
They understand probability.
A chart formation may increase the likelihood of a particular outcome, but it never guarantees one.
Markets are influenced by countless variables:
- Economic conditions
- Company fundamentals
- Interest rates
- Liquidity
- Investor sentiment
- Institutional participation
- Global events
Therefore, chart patterns should not be viewed as prediction tools.
They should be viewed as frameworks for analysing probability and market psychology.
The Difference Between Recognition and Understanding
Many traders learn chart patterns by memorising names.
Head and shoulders.
Flags.
Triangles.
Double bottoms.
Cup and handle formations.
However, memorisation alone does not create trading skill.
The deeper understanding comes from recognising the psychology behind each formation.
Every pattern represents a story.
Who is gaining confidence?
Who is losing conviction?
Where are buyers becoming aggressive?
Where are sellers becoming defensive?
Where is uncertainty increasing?
Where is participation changing?
A skilled trader does not merely see a pattern.
They interpret the behaviour creating the pattern.
This distinction separates mechanical pattern recognition from professional market analysis.
Why Patterns Fail
One of the most important lessons in technical analysis is understanding that patterns fail.
And this is not a weakness of chart patterns.
It is a reality of markets.
A breakout can fail.
A support level can break.
A reversal pattern can continue in the original direction.
A seemingly perfect setup can produce an unexpected outcome.
Why?
Because markets are not machines.
They are complex systems influenced by human decisions.
Professional traders therefore combine chart patterns with broader analysis:
- Market trend
- Volume behaviour
- Volatility conditions
- Risk management
- Position sizing
- Fundamental context
The objective is not to find certainty.
The objective is to improve decision quality.
Chart Patterns and the Psychology of Crowds
Financial markets are among the largest examples of collective human behaviour.
Millions of participants constantly interpret information, form expectations, and make decisions.
Crowd psychology creates momentum.
Crowd psychology creates panic.
Crowd psychology creates opportunities.
Chart patterns emerge because groups of people often respond similarly to similar situations.
During accumulation phases, informed investors gradually build positions while uncertainty remains high.
During distribution phases, optimism may continue while larger participants reduce exposure.
During breakouts, increasing participation can reinforce price movement as more traders respond to changing expectations.
The chart records the behaviour of the crowd.
The analyst attempts to understand it.
The Professional Perspective: Patterns Are Probabilities, Not Predictions
Perhaps the greatest lesson from chart pattern analysis is the importance of probabilistic thinking.
Successful market participants do not ask:
“Will this pattern definitely work?”
They ask:
“Does this pattern improve the probability of making a favourable decision?”
This mindset changes everything.
It reduces emotional attachment.
It encourages risk management.
It creates discipline.
A professional trader understands that even the highest-quality setup can fail.
The objective is not perfection.
The objective is consistency.
Markets reward those who manage uncertainty better than others.
From the Editor’s Desk
Throughout my journey as a trader, investor, research analyst and market educator, one observation has become increasingly clear:
Markets are constantly changing, but human behaviour changes very slowly.
The greatest value of chart patterns is not that they reveal the future.
They reveal human behaviour.
They help market participants understand how fear, greed, uncertainty and confidence appear through price movement.
Thomas Bulkowski’s research reminds us that technical analysis is not merely about identifying formations.
It is about understanding the psychology that creates them.
Patterns repeat because people repeat.
And as long as markets continue to be influenced by human decisions, understanding behaviour will remain one of the most valuable skills for every trader and investor.
About the Editor
Debaditya Chatterjee is the Editor of Market Mindset, an editorial publication focused on capital markets, investment psychology and professional decision-making.
As a Capital Markets Educator, Trader & Investor, he writes about behavioural finance, technical analysis, trading discipline, risk management and evidence-based investing. Through Market Mindset, he explores the principles, mental models and frameworks that help market participants develop professional thinking and make informed decisions in financial markets.
Editorial Disclaimer
This editorial is published for educational and informational purposes only. The views expressed are intended to encourage discussion on financial markets, investing, trading, technical analysis and investment psychology.
Nothing contained in this publication should be interpreted as investment advice, research recommendations or an offer to buy or sell any financial instrument. Readers should conduct their own due diligence and consult appropriate financial professionals before making investment decisions.
Editorial written by Debaditya Chatterjee for Market Mindset.